Query Builder Interface
Overview: Query Builder
The Docwize query builder is located in the ‘New’ Module, under ‘Custom Fields.’ This lists created views, as well as provides the place for users to create new queries to build new views.
'Query Builder' button
'Virtual Views' dialog
When users navigate to the 'Query Builder' section, they encounter the 'Virtual Views' dialog.
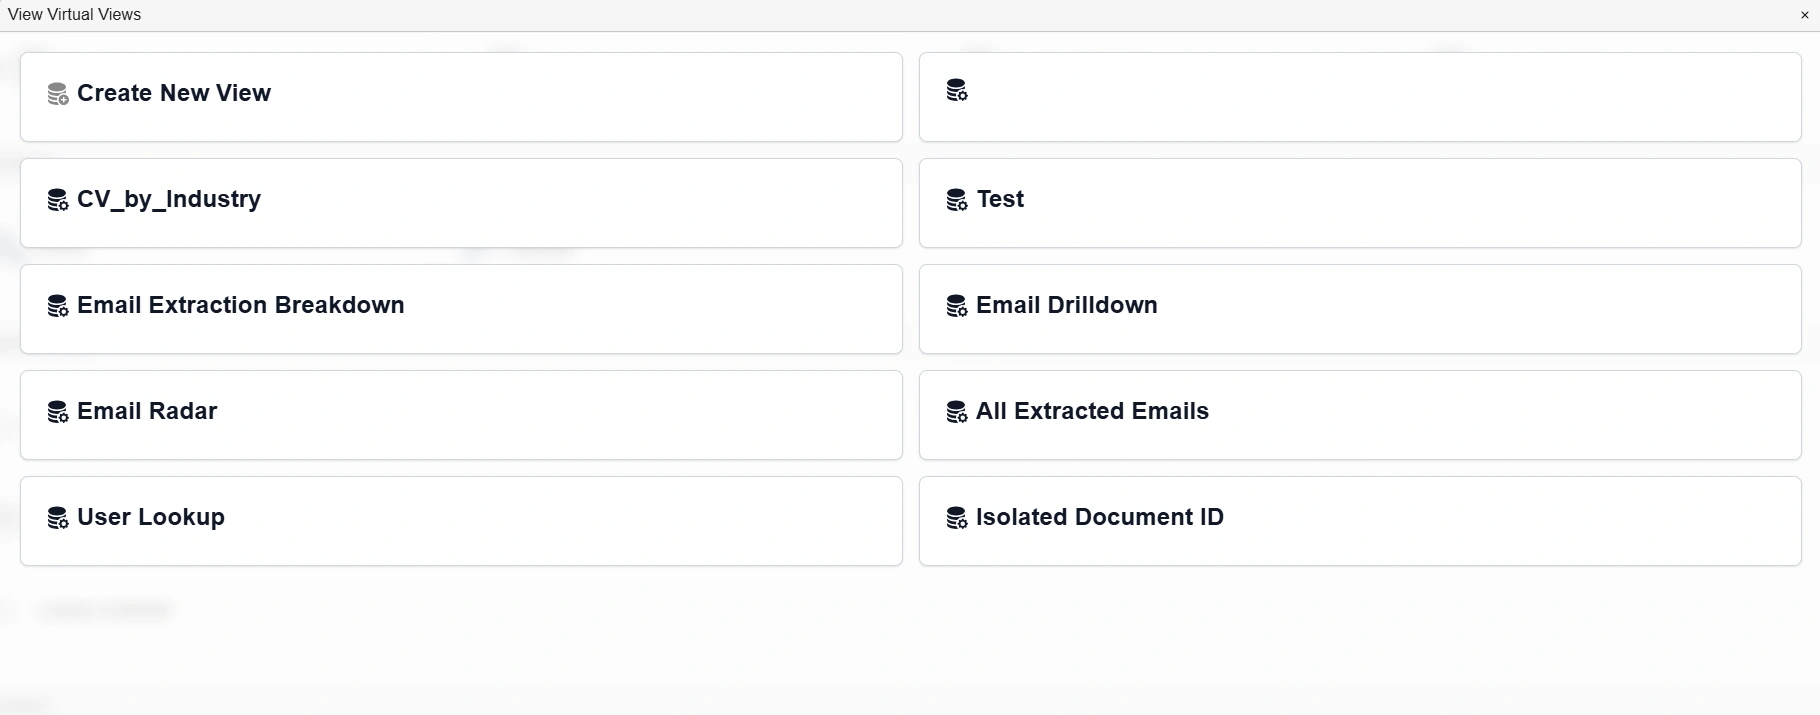
'Virtual Views' dialog
| Field | Description |
|---|---|
| Create New View | Navigates to the Query Lab canvas. |
| (Various names) | List of names of created views. |
The Query Lab
When users click on 'Create New View', they are directed to the Query Lab. Queries are built in the Query Lab's canvas.
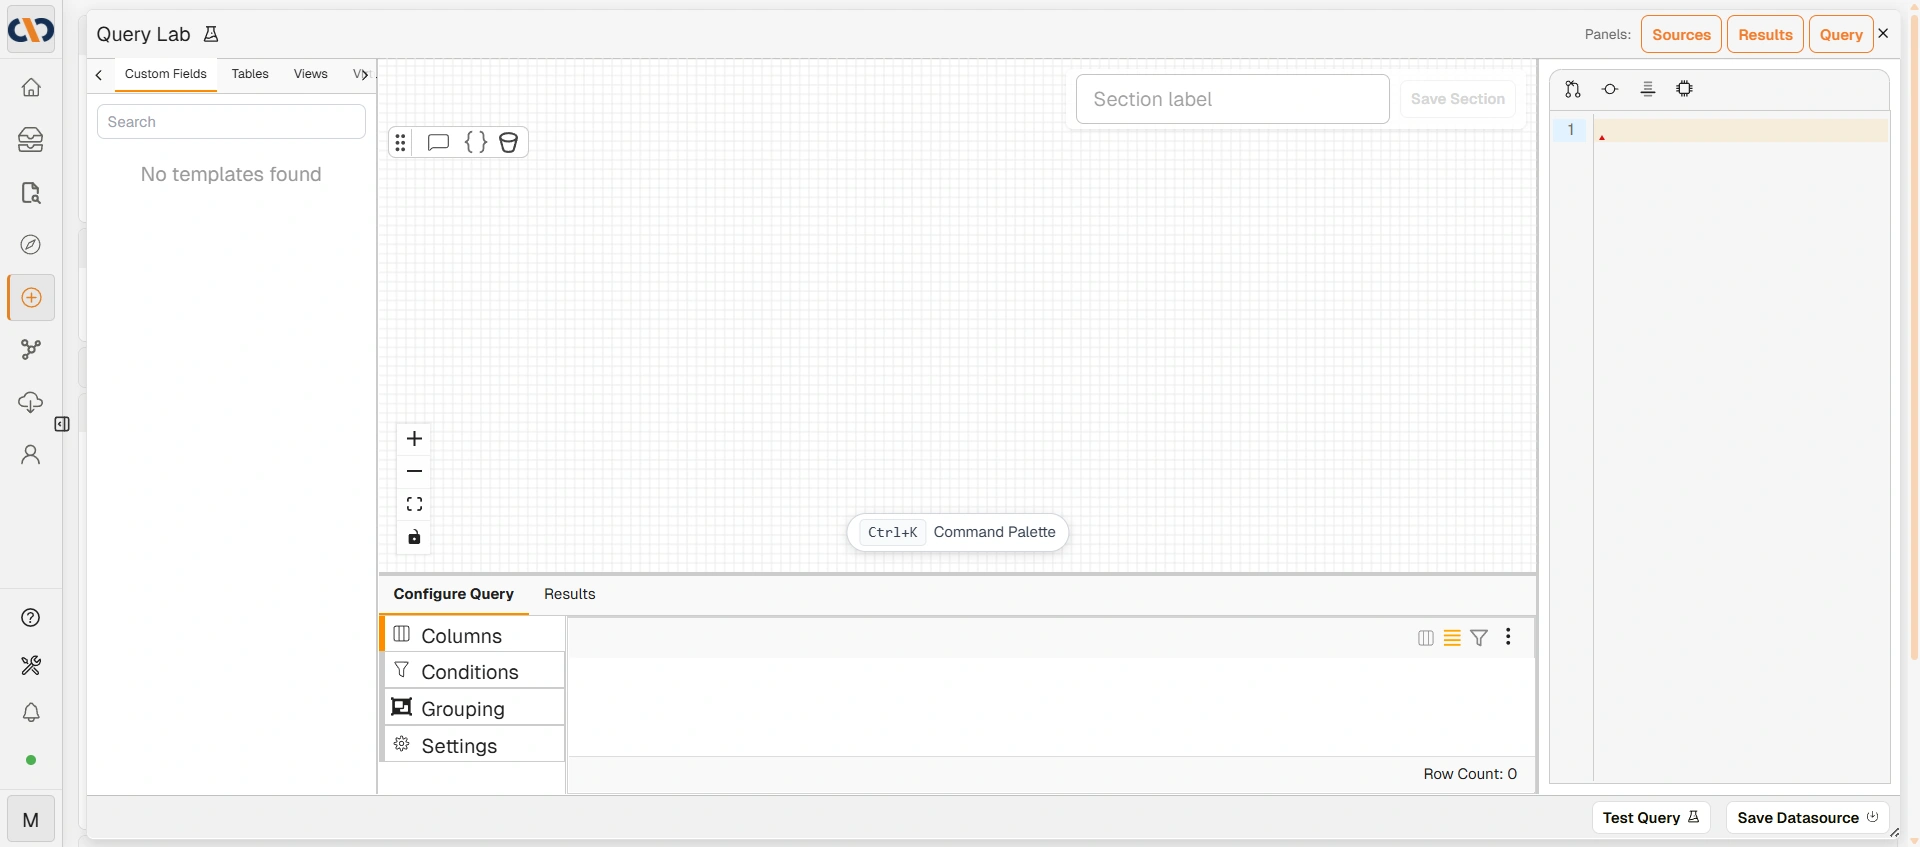
The Query Lab canvas
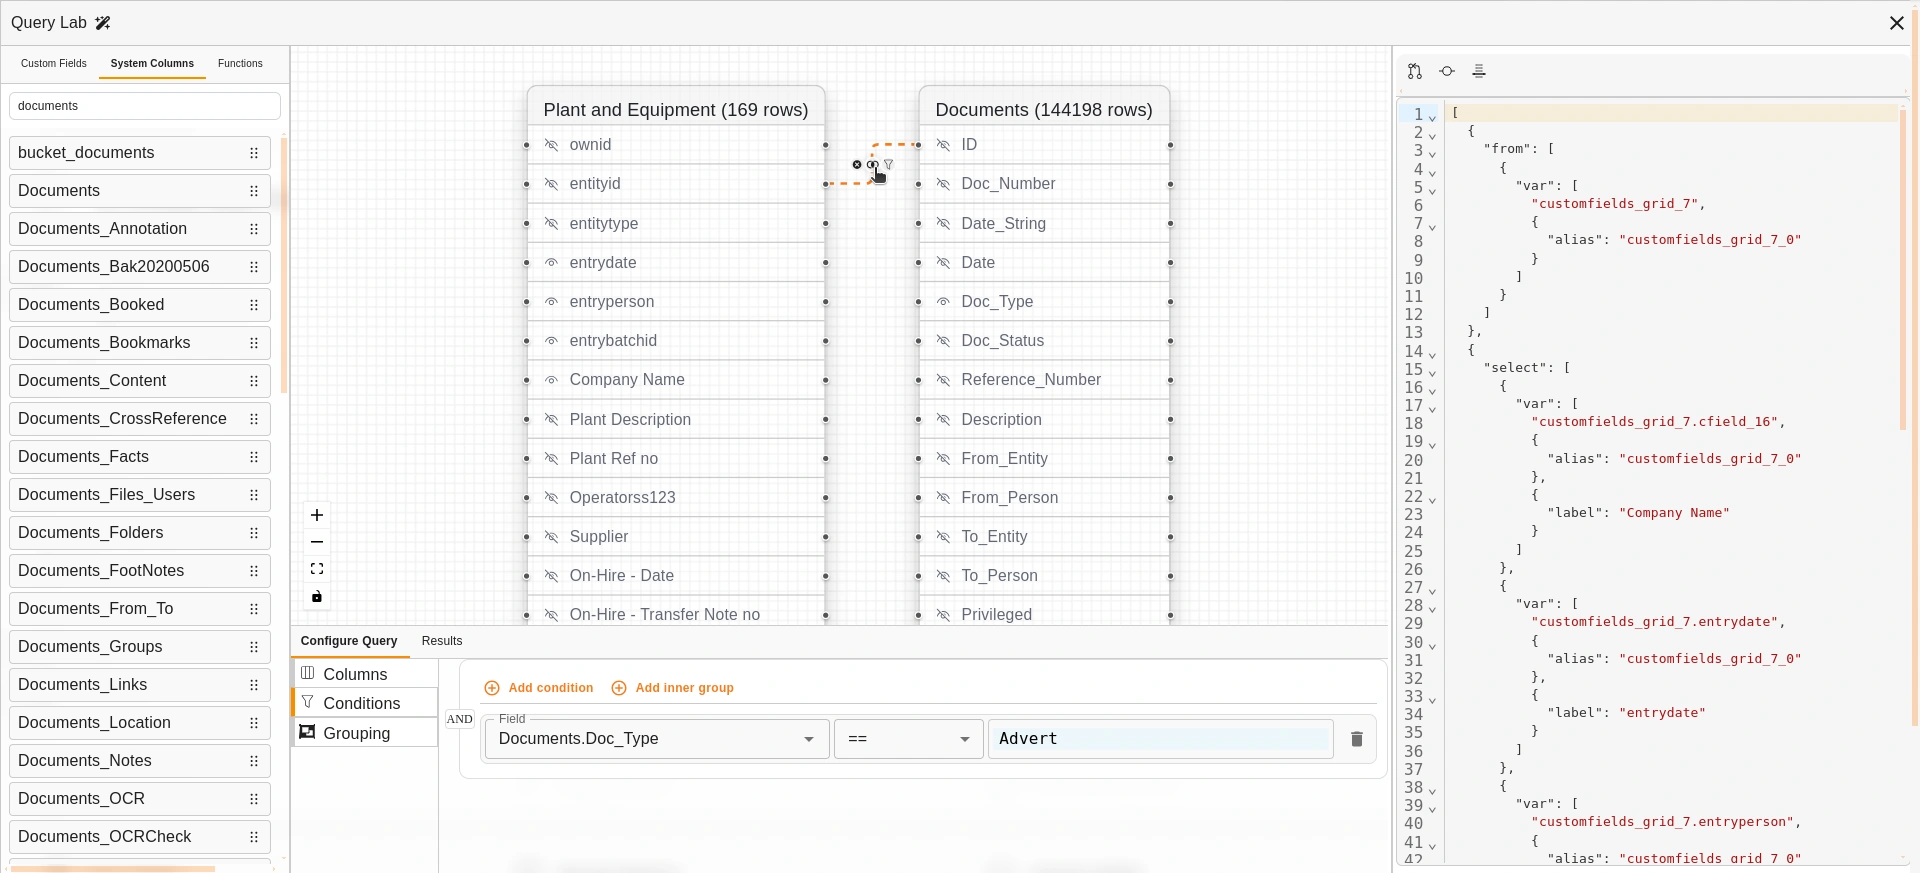
Query Builder: An example query
The Query Lab has four main sections.
Left-hand Section
The left-hand panel has the following tabs:
| Tab | Description |
|---|---|
| Custom Fields | Lists all available Custom Fields to drag onto the canvas. |
| Tables | Lists available system tables. |
| Views | Lists available system views. |
| Virtual Views | Lists existing virtual views that can be used as a data source. |
| Functions | Lists available query functions that can be dragged onto the canvas. |
| CTEs | Lists Common Table Expressions (CTEs) defined for the current query. |
A Search box at the top filters across all tabs. Each item has a drag handle to pull it onto the canvas.
Top Bar
| Field | Description |
|---|---|
| Section label | Optionally name the current section of the query. |
| Save Section | Saves the current section label. Enabled once a label is entered. |
| Panels | Toggles which panels are visible: Sources (left panel), Results (bottom panel), Query (right JSON panel). |
| Ctrl+K / Command Palette | Opens a command palette for quick actions. |
| Data connection | Displays the current database connection (e.g. Docwize Database). Click to open the Select Foreign Data Connection dialog and change the data source. |
Upper Central Section
This is the query builder canvas. Users can select items from the lefthand section to drag into the canvas. Fields that are dragged and dropped appear as a node.
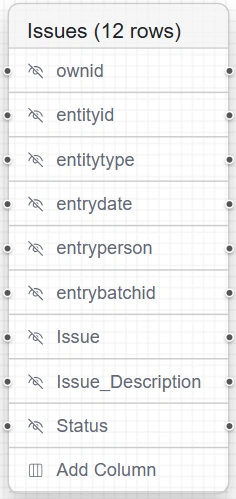
Example: Node
| Field | Description |
|---|---|
| Link nodes | Enables users to link nodes as they build a complex query. |
| Include in select (eye icon) | Includes the column in the select. |
| Description | The column name. Double-clicking the field allows the column to be renamed. |
There are certain fields in a node which are standard:
| Field | Description |
|---|---|
| OwnID | Unique ID in the table/view. |
| Entityid | Usually represents a document ID. |
| Entitytype | “D” for Document. |
| Entrydate | Date the row was inserted. |
| Entryperson | User ID of the user who did the insert. |
| entrybatchid | UUID unique to a batch insert. |
Bottom Central Section
The bottom panel has two top-level tabs: Configure Query and Results.
| Tab | Description |
|---|---|
| Configure Query | Shows the configuration sub-tabs: Columns, Conditions, Grouping, and Settings. |
| Results | Shows query results after clicking Test Query. |
When Configure Query is active, the following sub-tabs appear on the left:
| Sub-tab | Description |
|---|---|
| Columns | Column descriptions for the output query. |
| Conditions | Defines filter conditions applied to the query before results are returned. Conditions use AND/OR logic. Click + Add Condition to add a filter rule; click + Add Inner Group to nest a group of conditions within the current group. These conditions act as pre-filters — they restrict the virtual view’s output at the query level, before data is displayed in any dataview or interface that uses this view. |
| Grouping | Applies grouping and aggregations to the query results. |
| Settings | Additional query-level settings. |
When viewing the 'Results' view, users have access to the following:
| Field | Description |
|---|---|
| Select All | Fetch all rows. |
| Page Size | Batch size for pagination. |
| No/no rows | Total rows in the query. |
| Query Time | Time taken for query to execute. |
Right-hand Section
| Field | Description |
|---|---|
| Load from source | Loads the backend representation of a query (in JSON) for confirmation and/or editing. |
| Set as source | Uses the jsonlogic query as the source instead of the diagram. |
| Auto-format | Autoformats edits to JSON. |
| AI assist | Assists in fixing query errors. |
| Test Query | Enables users to run the query to preview results. |
| Save Datasource | Prompts the pop-up dialog for a user to save the created datasource. |
How to Build a Query
| Step | Description |
|---|---|
| 1 | Select the relevant field(s) and drag them onto the Query Lab canvas, where they convert to nodes. |
| 2 | Make the relevant row(s) visible on the selected nodes. |
| 3 | Optional: link rows across nodes. |
| 4 | Click Test Query and check the Results tab at the bottom to confirm what is populated. Adjust if needed. |
| 5 | Click Set as Source once editing is complete. |
| 6 | Click Save Datasource and enter a name. |