Chart Builder
Docwize's ‘Chart Builder’ enables users to create charts that pull from and reflect data sourced from within a database, such as Compliance Breakdowns, Billing Breakdowns, Task Management Tracking, etc. Users can add further customizations to their charts, such as color-based categorization, linking actions to data, etc.
The ‘Chart Builder’ is located in the ‘New’ module, under ‘Custom Fields’.

'Chart Builder' button
'Chart Builder' Interface
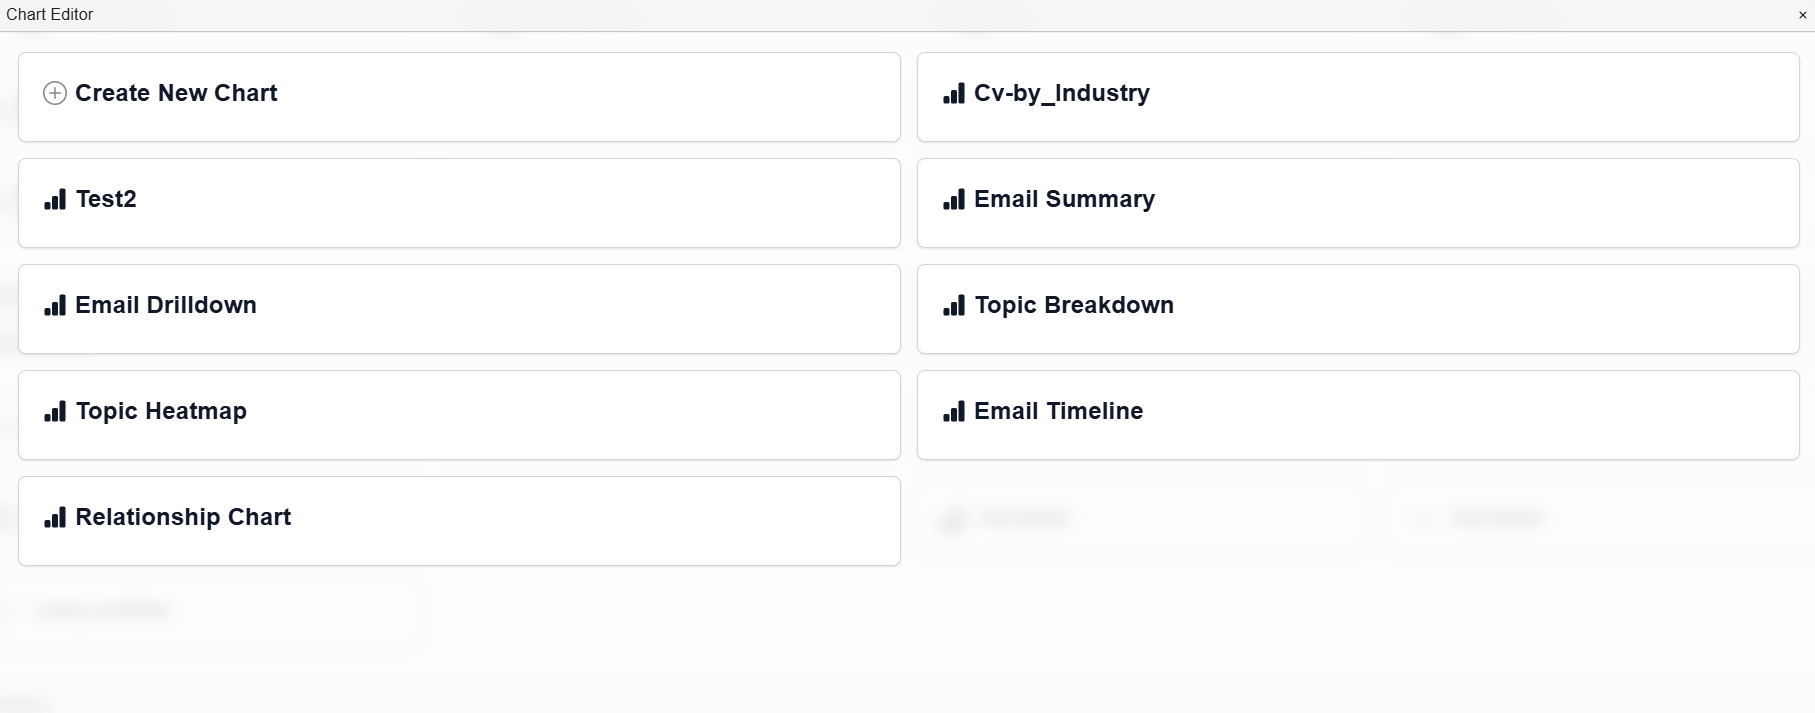
Example: 'Chart Builder' Interface
| Field | Description |
|---|---|
| Create New Chart | Navigates to the 'Chart Builder' dialog to create a new chart. |
| (varies) | Lists all created charts. |
'Chart Builder' Dialog
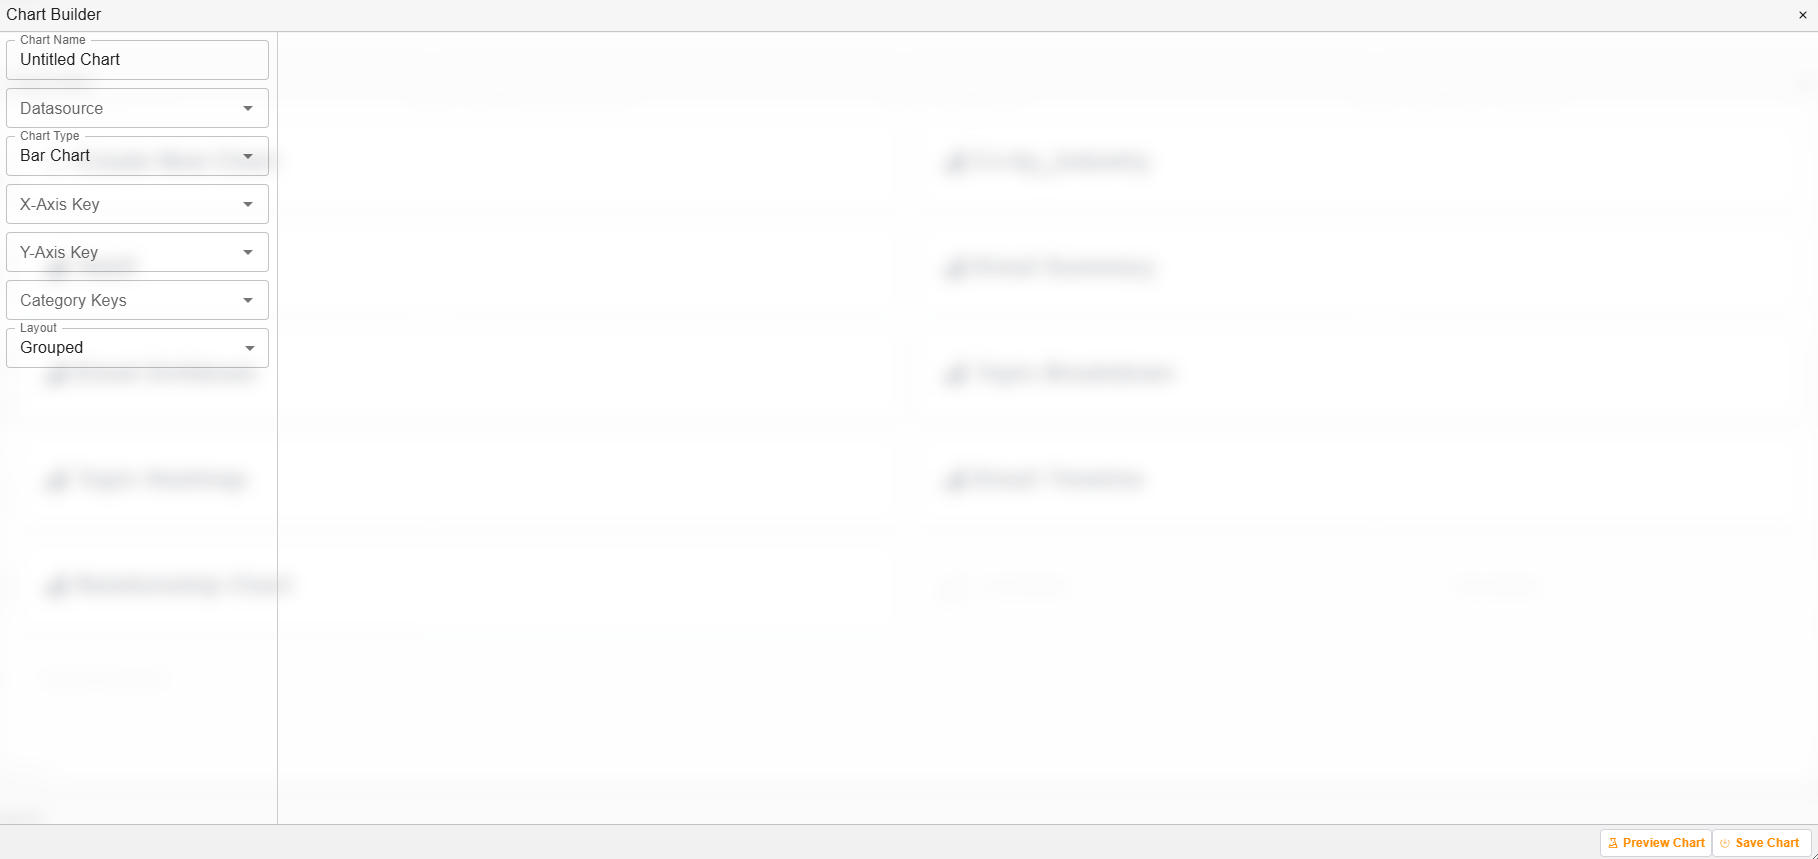
'Chart Builder' dialog
| Field | Description |
|---|---|
| Chart Name | Users can input the relevant chart name. |
| Datasource | A dropdown menu of all possible datasources created in the query builder. |
| Chart Type | Users can select the preferred chart type. Depending on what is selected, additional fields will appear for completion. |
| Preview Chart | Users can click on ‘Preview Chart’ to populate a preview of the chart they are creating. It will appear on the canvas. |
| Save Chart | Once complete, users can select ‘Save Chart’. |
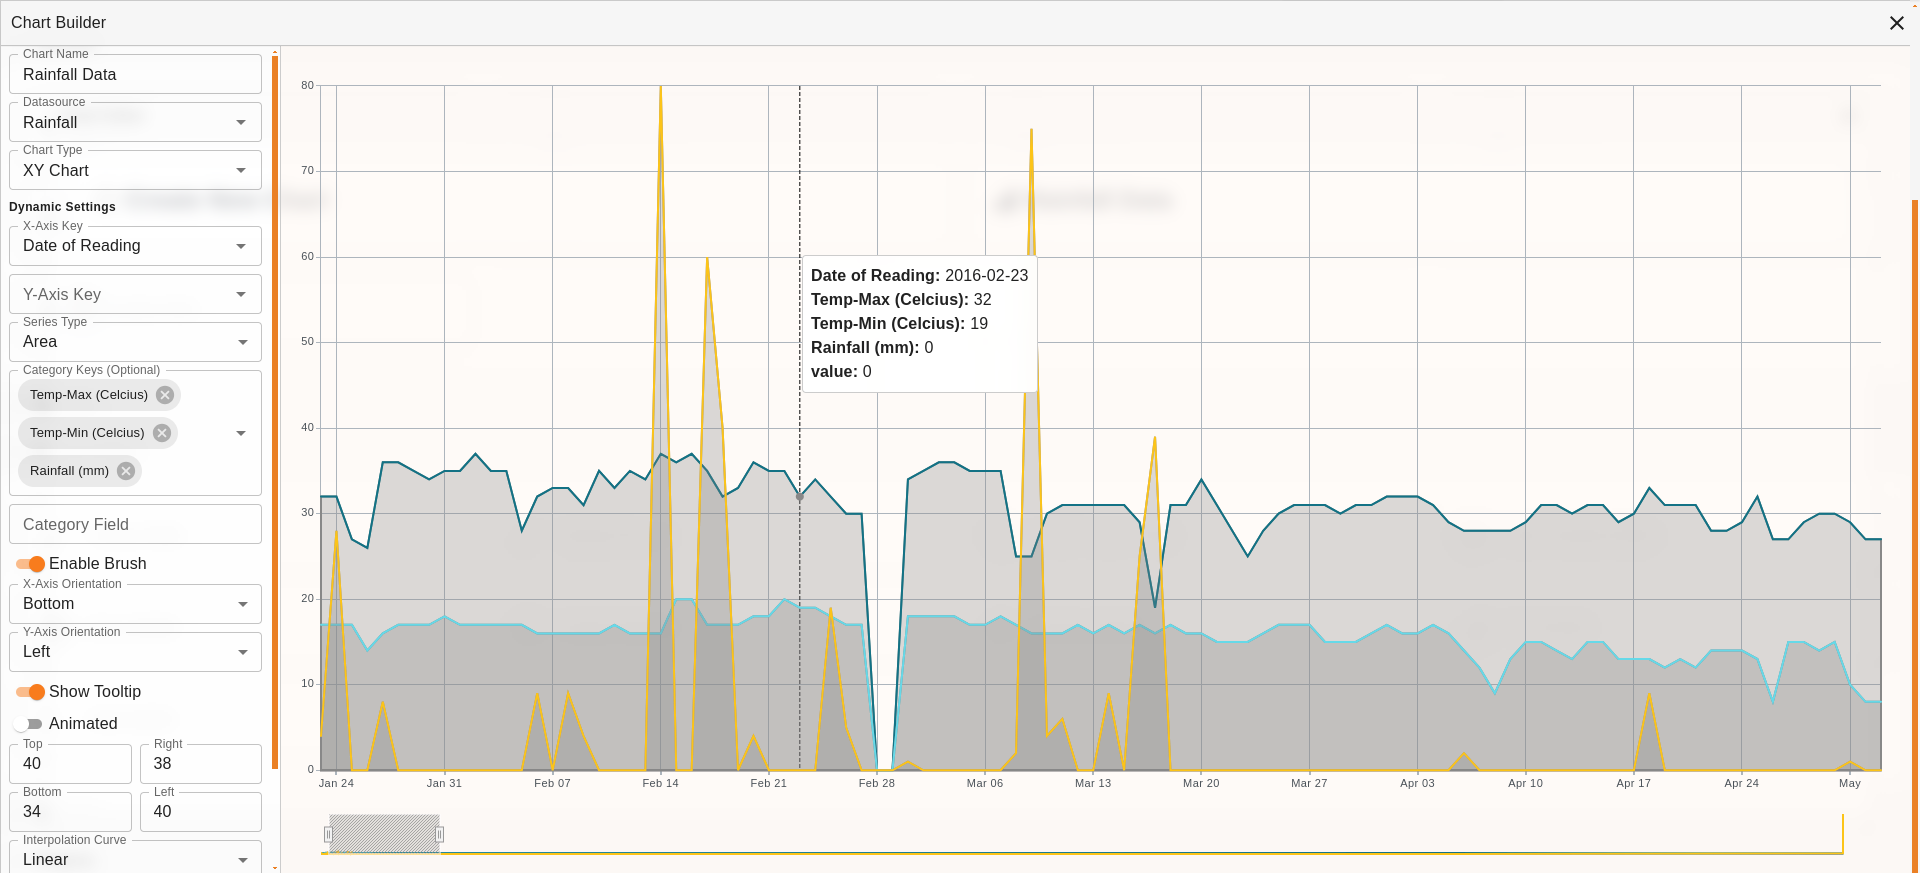
Example: A Built Chart
How to Build a Chart
| Step | Description |
|---|---|
| 1 | Navigate to the ‘Chart Builder’ section. |
| 2 | Select ‘Create New Chart’. |
| 3 | Name the chart, select the datasource and chart type. Complete additional fields, as applicable. |
| 4 | Click on ‘Save Chart’. |