Chart Builder
The Chart Builder turns a virtual view into a visual chart. Select a datasource, choose a chart type, configure how data is grouped and displayed, then save the chart for use in the Interface Builder.
Who configures this
Users with access to the New module. The Chart Builder is accessible from New > Custom Fields & Configuration > Chart Builder.
Before you start
A virtual view (datasource) must exist before a chart can be created. See Query Builder.
Chart Editor
When users navigate to the Chart Builder, they see the Chart Editor panel, which lists existing charts and provides access to create a new one.
| Field | Description |
|---|---|
| Create New Chart | Opens the Chart Builder dialog to create a new chart. |
| (Various names) | List of existing charts. |
Chart Builder dialog
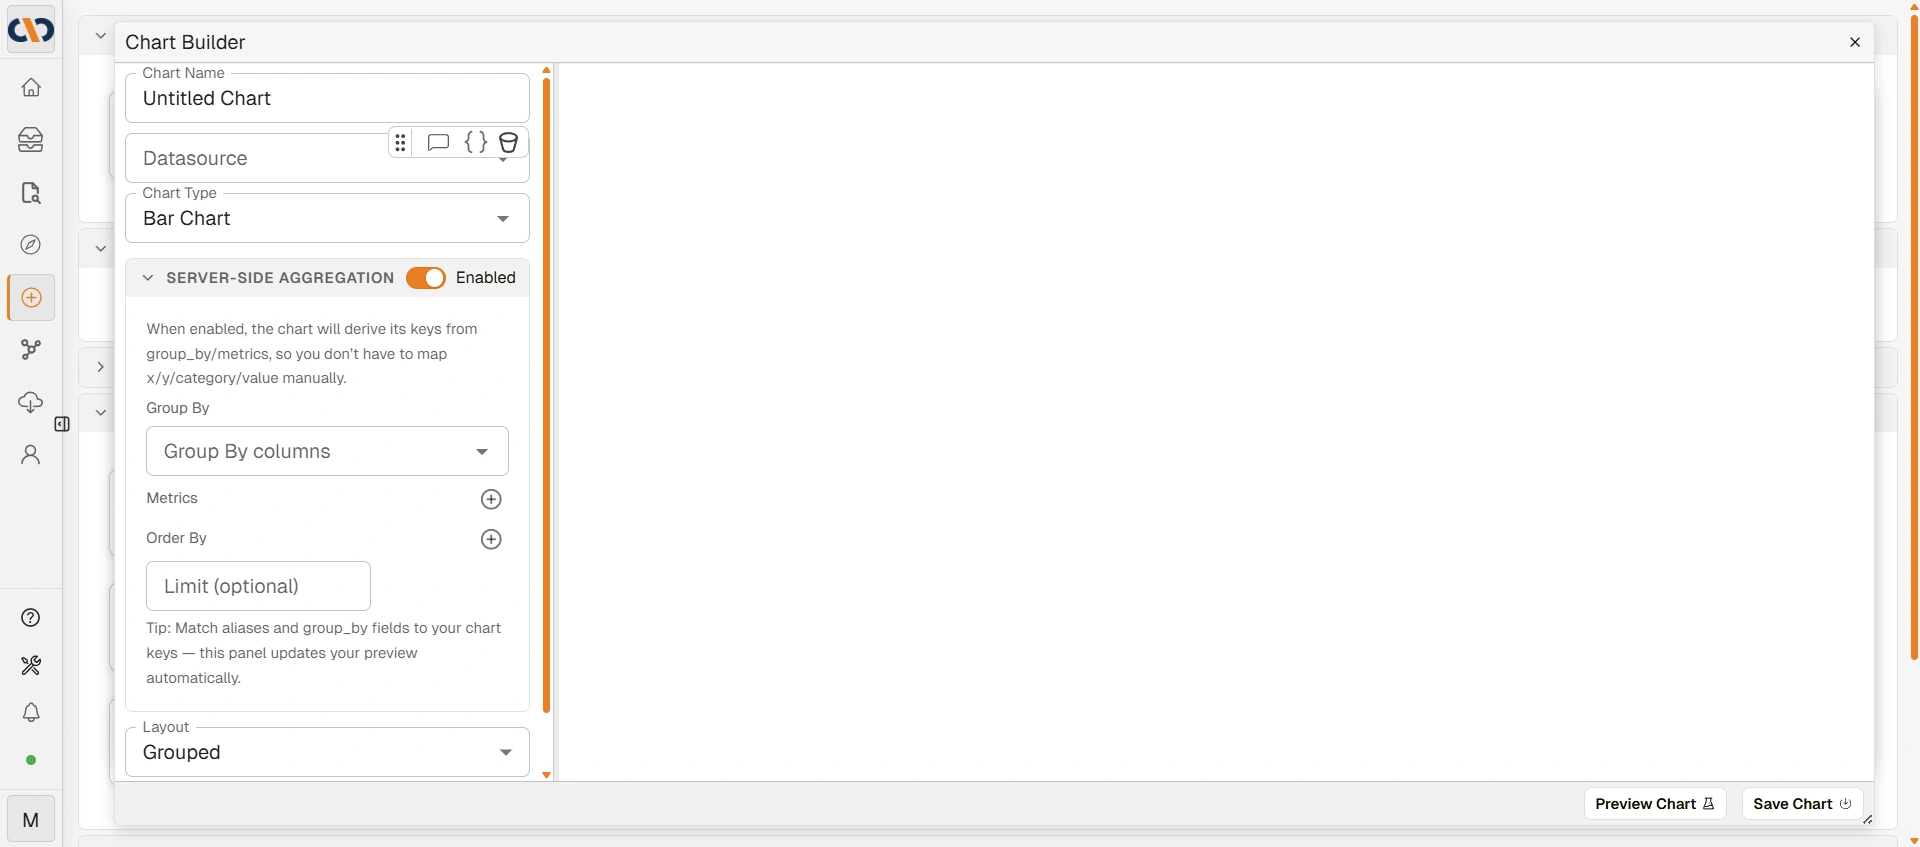
Chart Builder dialog
| Field | Description |
|---|---|
| Chart Name | The name for the chart. |
| Datasource | Dropdown of all virtual views created in the Query Builder. |
| Chart Type | Select the chart type (Bar Chart, Datagrid, Donut, Gantt, etc.). Additional fields appear depending on the type selected. |
| Server-Side Aggregation | Toggle (enabled by default). When enabled, the chart derives its grouping keys from the settings below. |
| Layout | Displayed when a Bar Chart is selected. Choose Grouped or Stacked. |
| Preview Chart | Renders a preview of the chart. |
| Save Chart | Saves the chart. |
Server-Side Aggregation
When Server-Side Aggregation is enabled (the default), the following fields are available:
| Field | Description |
|---|---|
| Group By | Select one or more columns to group results by. |
| Metrics | Add one or more aggregate metrics (COUNT, SUM, etc.). Click Add metric to add a row. |
| Order By | Optionally sort the results. Click Add order by to add a sort rule. |
| Limit (optional) | Limit the number of rows returned. Leave blank for no limit. |
When Server-Side Aggregation is disabled, a Legacy field mapping section appears instead, allowing manual mapping of X-Axis Key, Y-Axis Key, and Category Keys.
How to build a chart
| Step | Description |
|---|---|
| 1 | Navigate to New > Custom Fields & Configuration > Chart Builder. |
| 2 | Click Create New Chart. |
| 3 | Enter a chart name, select a datasource, and choose a chart type. |
| 4 | Configure Server-Side Aggregation: set Group By columns and add metrics as needed. |
| 5 | Click Preview Chart to verify the output. |
| 6 | Click Save Chart. |
Troubleshooting
| Issue | Detail |
|---|---|
| No datasources available | A virtual view must exist before a chart can be created. Create one in the Query Builder first. |
| Preview shows no data | Check that the datasource contains data and that Group By columns and Metrics are correctly configured. |
| Chart type changed but still no data | Some chart types require specific data shapes. Verify that Group By and Metrics settings match the selected chart type. |
| Legacy field mapping not working | Legacy field mapping is disabled while Server-Side Aggregation is enabled. Disable SSA to access it, or reconfigure using the SSA fields instead. |
Related configuration
- Query Builder — creates the virtual views (datasources) that charts are built from
- Interface Builder — assembles charts into user-facing dashboards
- Building Virtual Interfaces — how the Query Builder, Chart Builder, and Interface Builder connect