Building Virtual Interfaces: How the Tools Connect
A virtual interface is a configurable dashboard that pulls data from your Docwize system and presents it to selected users. It can display tables, charts, and forms — and can be restricted to specific users or groups. Virtual interfaces are visible to users via Explorer → Virtual Interfaces.
Building one requires three tools, used in order.
The Three-Step Pipeline
Each tool produces something that the next tool uses as its input:
| Step | Tool | What you do | What it produces |
|---|---|---|---|
| 1 | Query Builder | Select a data source and define which fields to include, filter, or group | A virtual view (datasource) |
| 2 | Chart Builder | Choose a datasource and a chart type; configure grouping and display | A chart |
| 3 | Interface Builder | Combine one or more charts (and optionally custom fields) into a layout | A virtual interface visible to users |
Even if you only want a simple data table, you still need to create a virtual view first. The Chart Builder cannot work without a datasource, and the Interface Builder cannot work without a chart.
Where to Find the Tools
All three tools are in New → Custom Fields & Configuration.
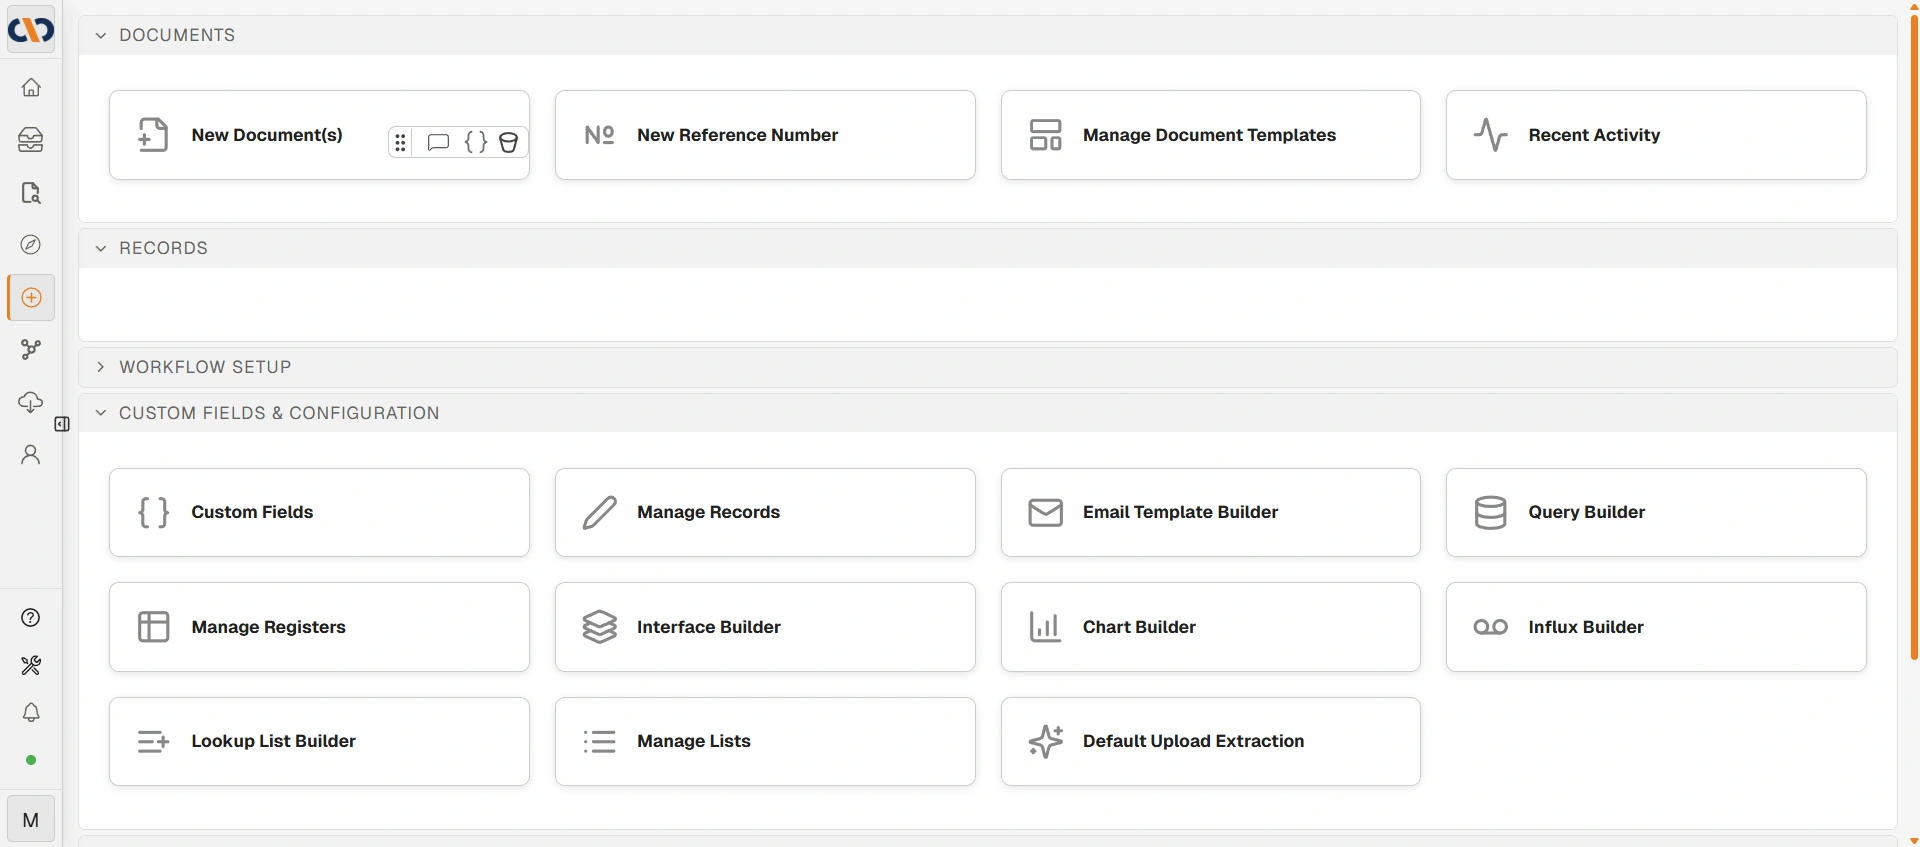
New → Custom Fields & Configuration
Step 1 — Query Builder
The Query Builder creates virtual views: saved queries that define a dataset. A virtual view is the data layer that everything else connects to.
Use the Query Lab to:
- Drag data sources (custom fields, tables, or existing views) onto the canvas
- Choose which fields to include and rename them for clarity
- Apply filters and groupings
- Test the query before saving
When you save, give the datasource a clear name — you will select it by name in the Chart Builder.
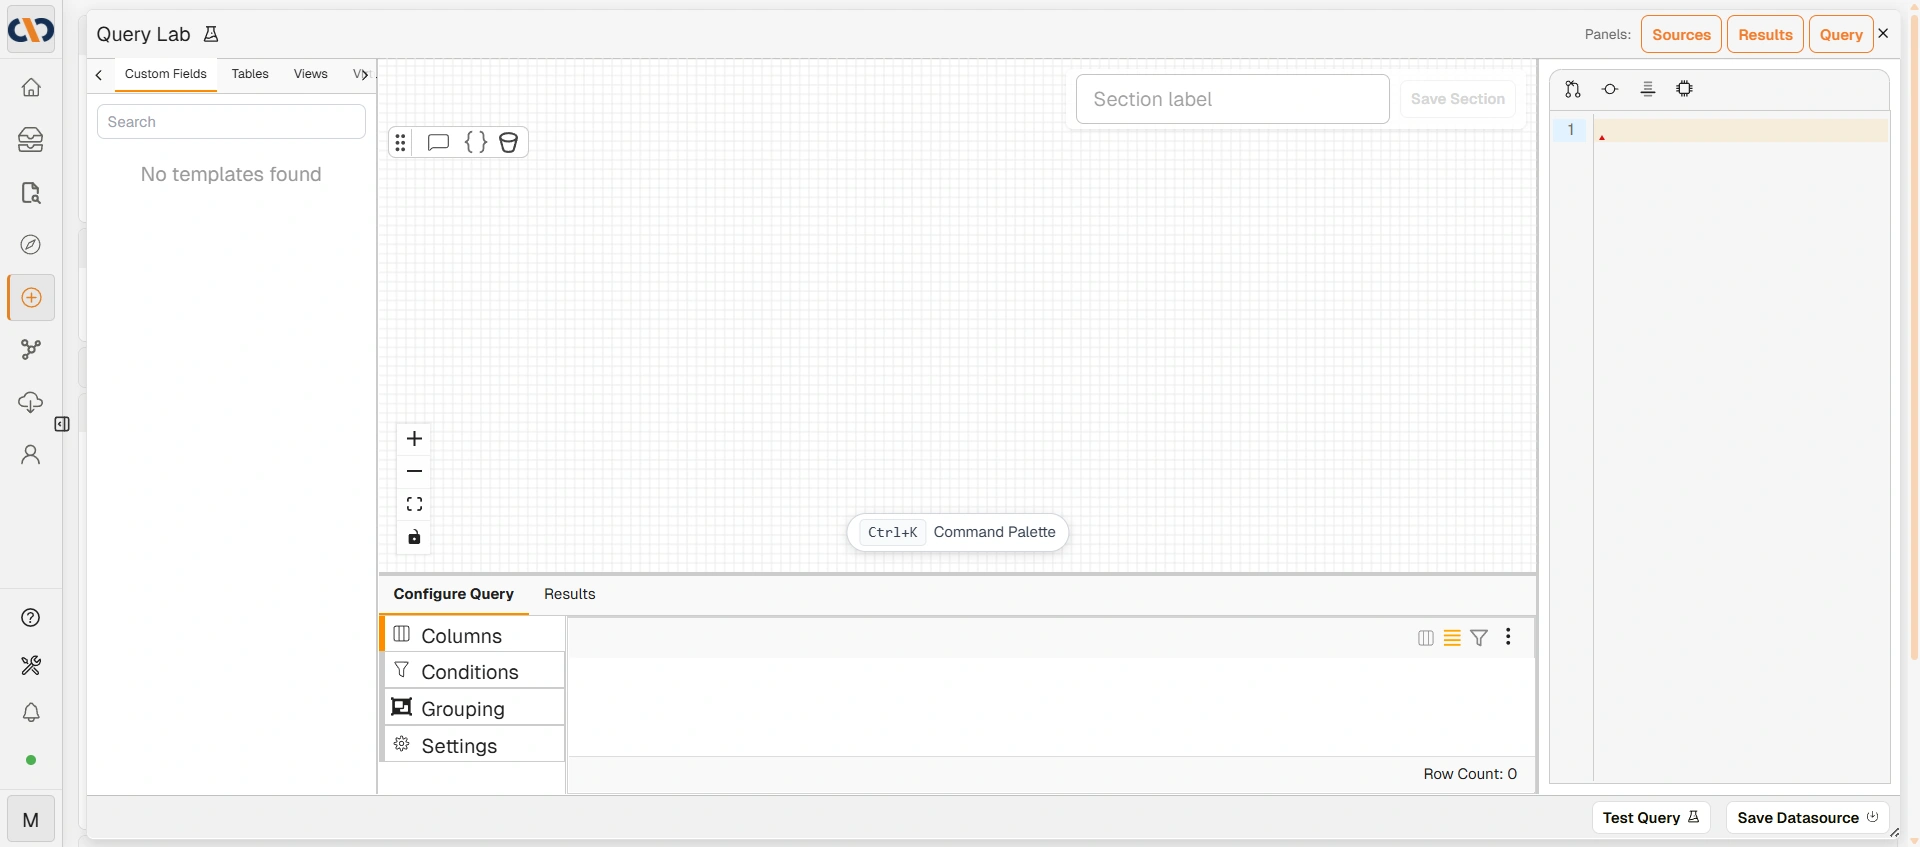
The Query Lab
→ See Query Builder Interface for full details.
Step 2 — Chart Builder
The Chart Builder turns a virtual view into a visual chart. Select the datasource you created in Step 1, choose a chart type (table/datagrid, bar, donut, Gantt, etc.), and configure how data is grouped and displayed.
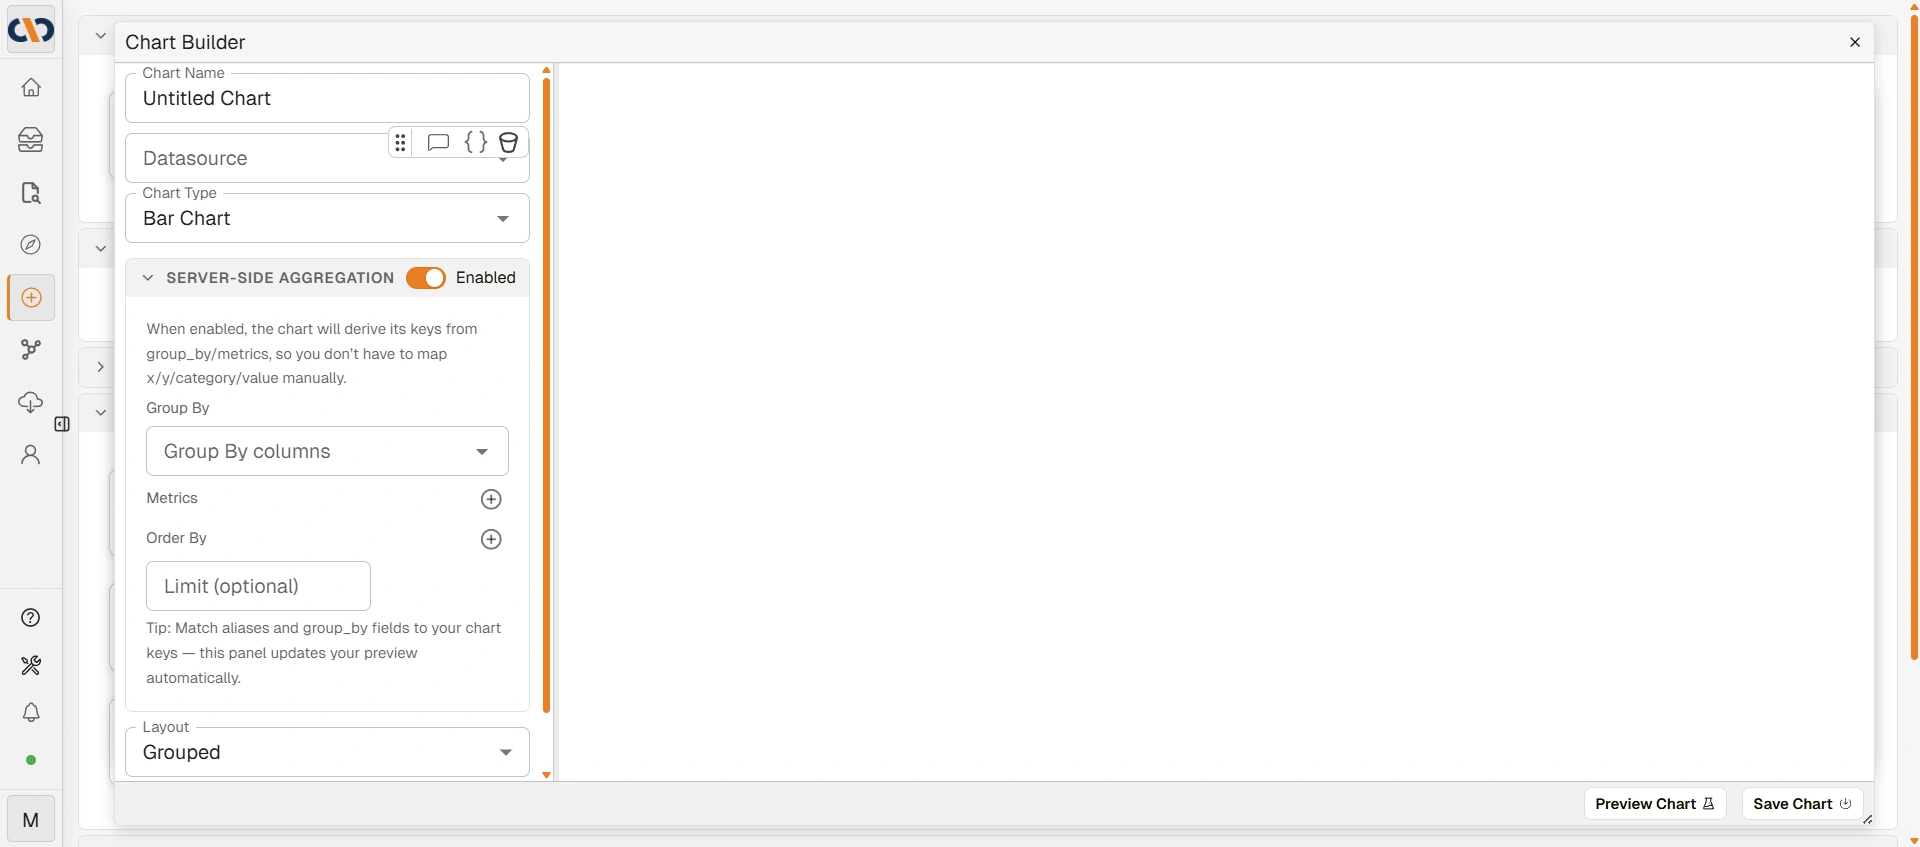
The Chart Builder dialog
Use Preview Chart to verify the output before saving.
→ See Chart Builder for full details.
Step 3 — Interface Builder
The Interface Builder assembles charts (and optionally custom fields or tab groups) into a layout that users see as a dashboard.
Drag components from the left panel onto the canvas and resize them to fit. When you click Save, you name the interface and set which users or groups can see it.
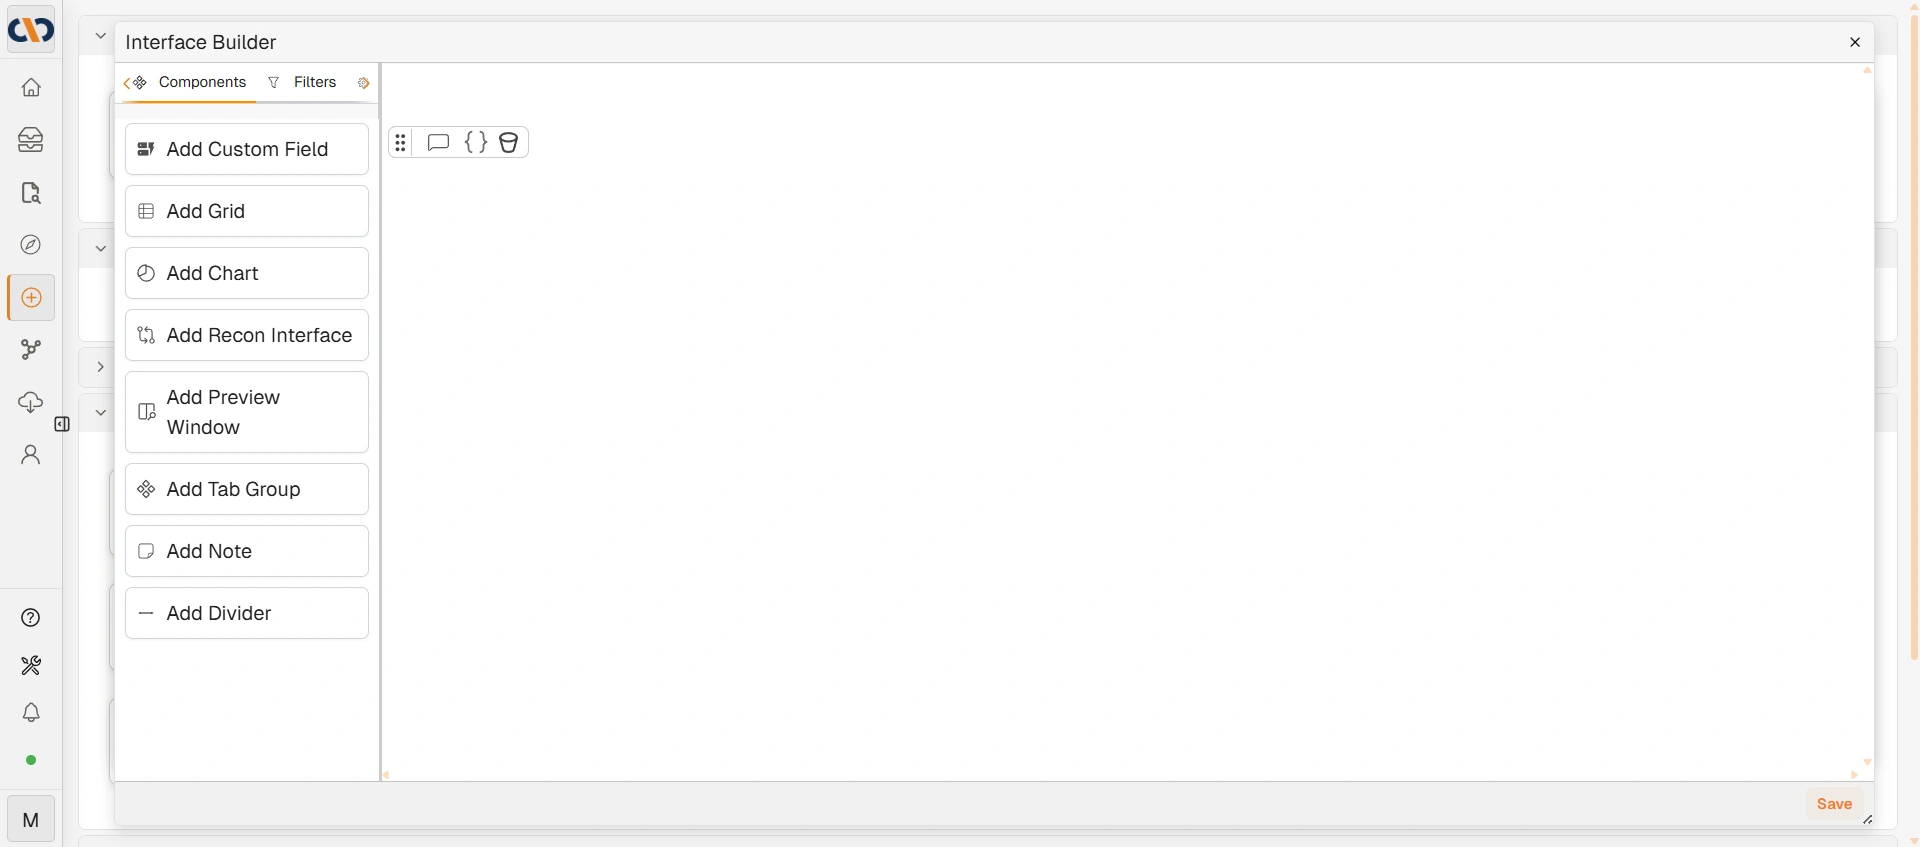
The Interface Builder
→ See Interface Builder for full details.
Security: Who Can See the Interface
Access is set when you save the interface. You can grant access to individual users or groups. Only users (or group members) listed here will see the interface appear under Explorer → Virtual Interfaces.
This is separate from any row-level data filtering in the underlying virtual view — the two operate independently.
Using Virtual Interfaces with Oliver
Virtual interfaces can serve as context surfaces for Oliver AI agents, allowing agents to reference structured data from your interface when responding to queries or performing tasks.
Important: Always Use the UI Builders
Virtual interfaces, charts, and virtual views must be created using the three builder tools above. Attempting to create them by editing the database directly produces objects that are invisible or broken in the portal, because the builders generate required internal identifiers and structure that cannot be replicated manually.