仮想インターフェースの構築:ツールの接続方法
仮想インターフェースは、Docwizeシステムからデータを取得して特定のユーザーに提示する、設定可能なダッシュボードです。テーブル、グラフ、フォームを表示でき、特定のユーザーやグループにアクセスを制限することができます。ユーザーはエクスプローラー → 仮想インターフェースから仮想インターフェースを閲覧できます。
これらを構築するには、3つのツールを順番に使用する必要があります。
3ステップのパイプライン
各ツールは、次のツールが入力として使用するものを生成します。
| ステップ | ツール | 行う作業 | 生成されるもの |
|---|---|---|---|
| 1 | クエリビルダー | データソースを選択し、含めるフィールド、フィルター、グループ化を定義する | 仮想ビュー(データソース) |
| 2 | チャートビルダー | データソースとチャートタイプを選択し、グループ化と表示を設定する | チャート |
| 3 | インターフェースビルダー | 1つ以上のチャート(およびオプションでカスタムフィールド)をレイアウトに組み合わせる | ユーザーに表示される仮想インターフェース |
シンプルなデータテーブルのみが必要な場合でも、最初に仮想ビューを作成する必要があります。チャートビルダーはデータソースなしでは機能せず、インターフェースビルダーはチャートなしでは機能しません。
ツールの場所
すべての3つのツールは、新規 → カスタムフィールドと設定にあります。
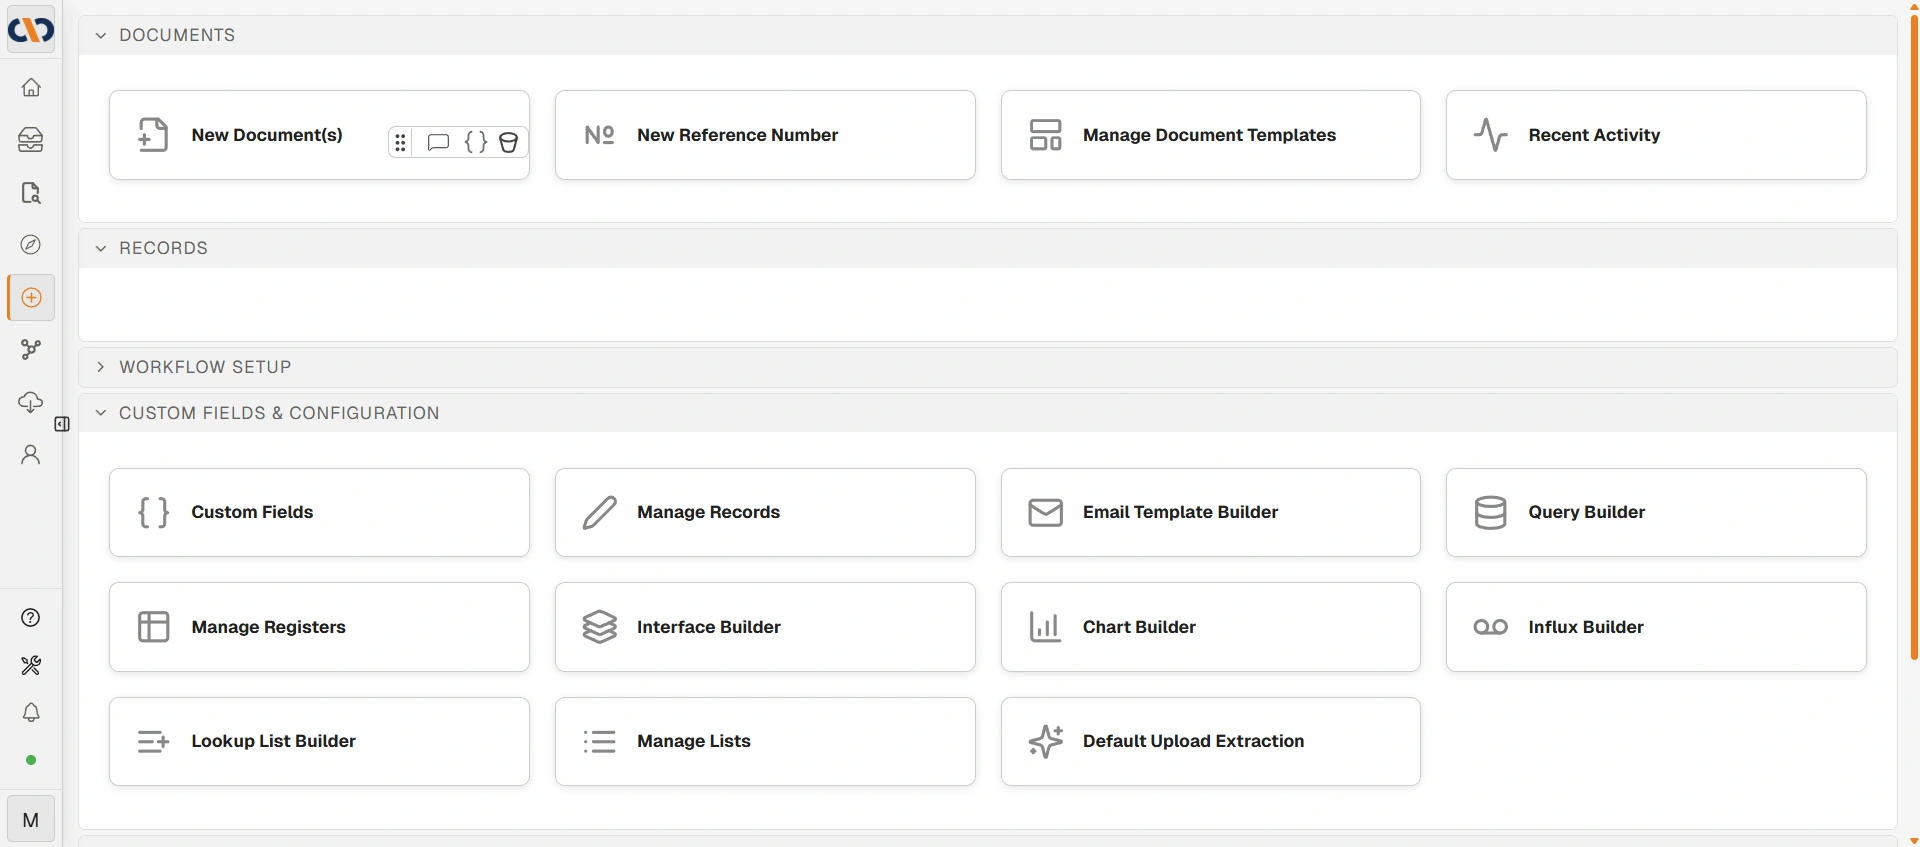
新規 → カスタムフィールドと設定
ステップ 1 — クエリビルダー
クエリビルダーは仮想ビューを作成します。これはデータセットを定義する保存されたクエリです。仮想ビューは、他のすべてのものが接続するデータレイヤーです。
クエリラボを使用して、以下の作業を行います。
- データソース(カスタムフィールド、テーブル、または既存のビュー)をキャンバスにドラッグする
- 含めるフィールドを選択し、わかりやすいように名前を変更する
- フィルターとグループ化を適用する
- 保存する前にクエリをテストする
保存する際は、データソースにわかりやすい名前を付けてください。チャートビルダーで名前を指定して選択することになります。
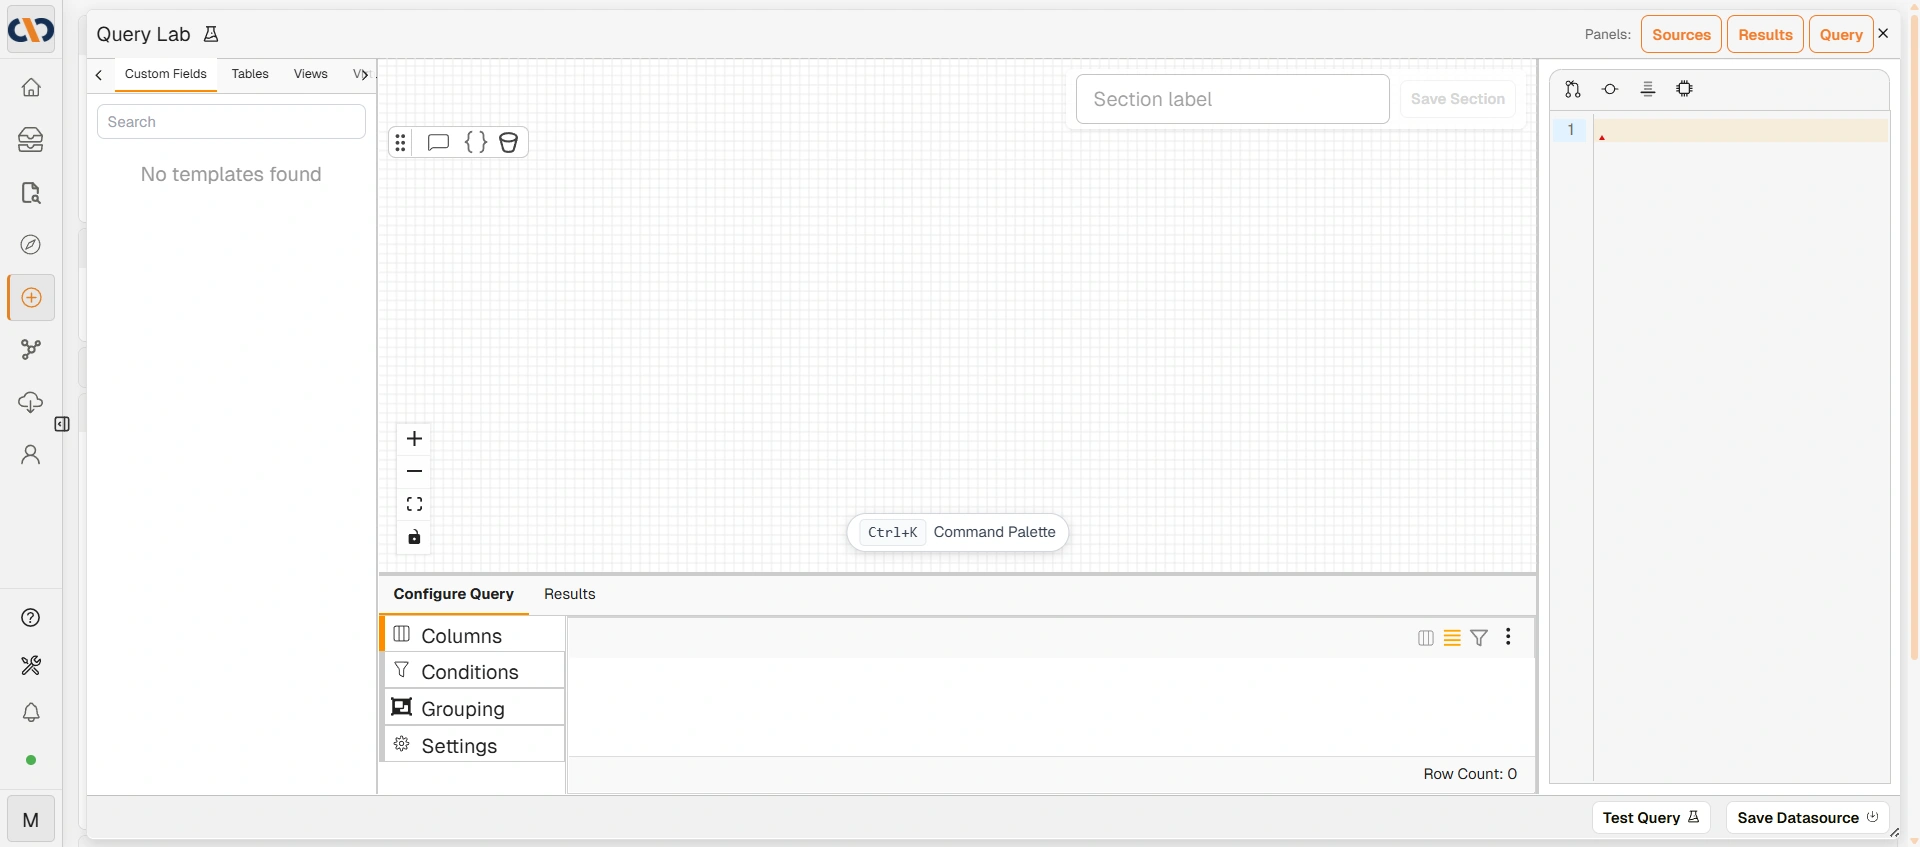
クエリラボ
→ 詳細については、クエリビルダーインターフェースを参照してください。
ステップ 2 — チャートビルダー
チャートビルダーは、仮想ビューを視覚的なチャートに変換します。ステップ1で作成したデータソースを選択し、チャートの種類(テーブル/データグリッド、棒グラフ、ドーナツグラフ、ガントチャートなど)を選択して、データのグループ化と表示方法を設定します。
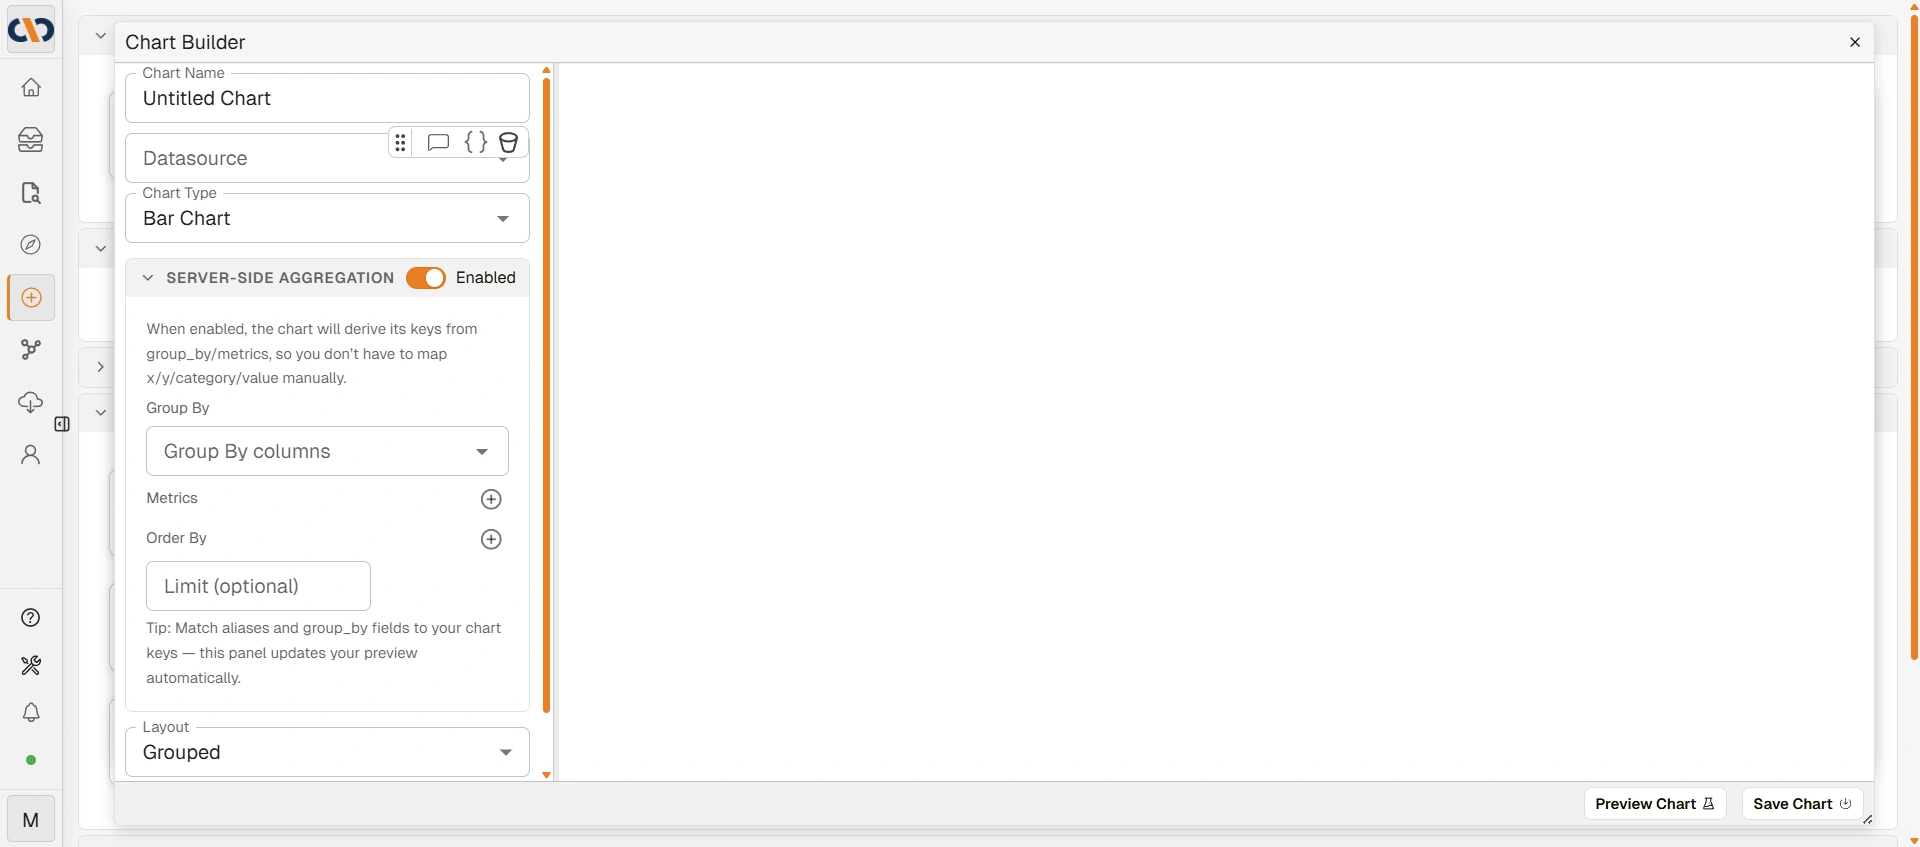
チャートビルダーのダイアログ
保存する前に、チャートのプレビューを使用して出力を確認してください。
→ 詳細については、チャートビルダーを参照してください。
ステップ 3 — インターフェースビルダー
インターフェースビルダーは、チャート(およびオプションでカスタムフィールドやタブグループ)を、ユーザーがダッシュボードとして表示するレイアウトに組み立てます。
左側のパネルからコンポーネントをキャンバスにドラッグし、サイズを調整して配置します。保存をクリックすると、インターフェースに名前を付け、表示できるユーザーまたはグループを設定します。
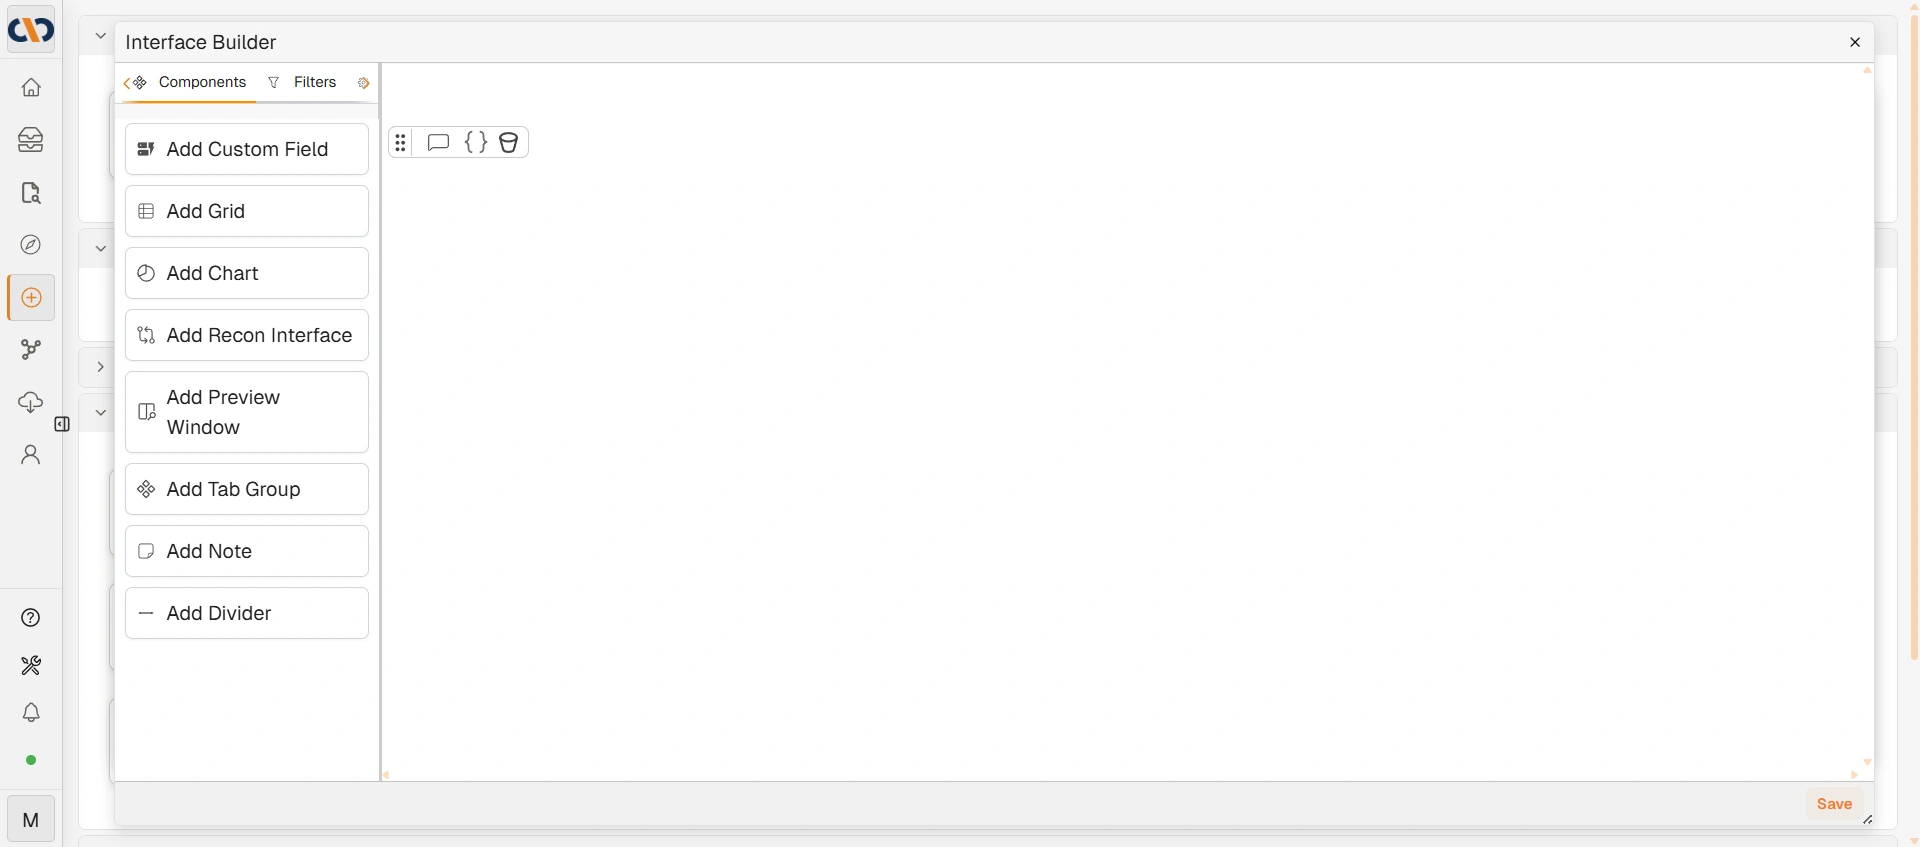
インターフェースビルダー
→ 詳細については、インターフェースビルダーを参照してください。
セキュリティ:インターフェースを表示できるユーザー
アクセス権は、インターフェースを保存するときに設定します。個々のユーザーまたはグループにアクセス権を付与できます。ここにリストされているユーザー(またはグループメンバー)のみに、エクスプローラー → 仮想インターフェースの下にインターフェースが表示されます。
これは、基になる仮想ビューでの行レベルのデータフィルタリングとは別の機能であり、それぞれ独立して動作します。
Oliverでの仮想インターフェースの使用
仮想インターフェースは、AIアシスタント「Oliver」のコンテキスト情報として機能させることができます。これにより、Oliverが質問に答えたりタスクを実行したりする際に、インターフェースからの構造化データを参照できるようになります。
重要:常にUIビルダーを使用すること
仮想インターフェース、チャート、および仮想ビューは、上記の3つのビルダーツールを使用して作成する必要があります。データベースを直接編集して作成しようとすると、ポータル上で表示されなかったり破損したりします。これは、ビルダーが手動では複製できない必要な内部識別子や構造を生成するためです。