Interface Builder
The Interface Builder assembles charts, custom fields, and data grids into a configurable dashboard that selected users can access via Explorer > Virtual Interfaces. It is the final step in the virtual interfaces pipeline.
Who configures this
Users with access to the New module. The Interface Builder is accessible from New > Custom Fields & Configuration > Interface Builder.
Before you start
At least one chart must exist before components can be added to an interface. See Chart Builder.
Interface Builder canvas
When users navigate to the Interface Builder, they see the canvas with a left panel and a Save button.
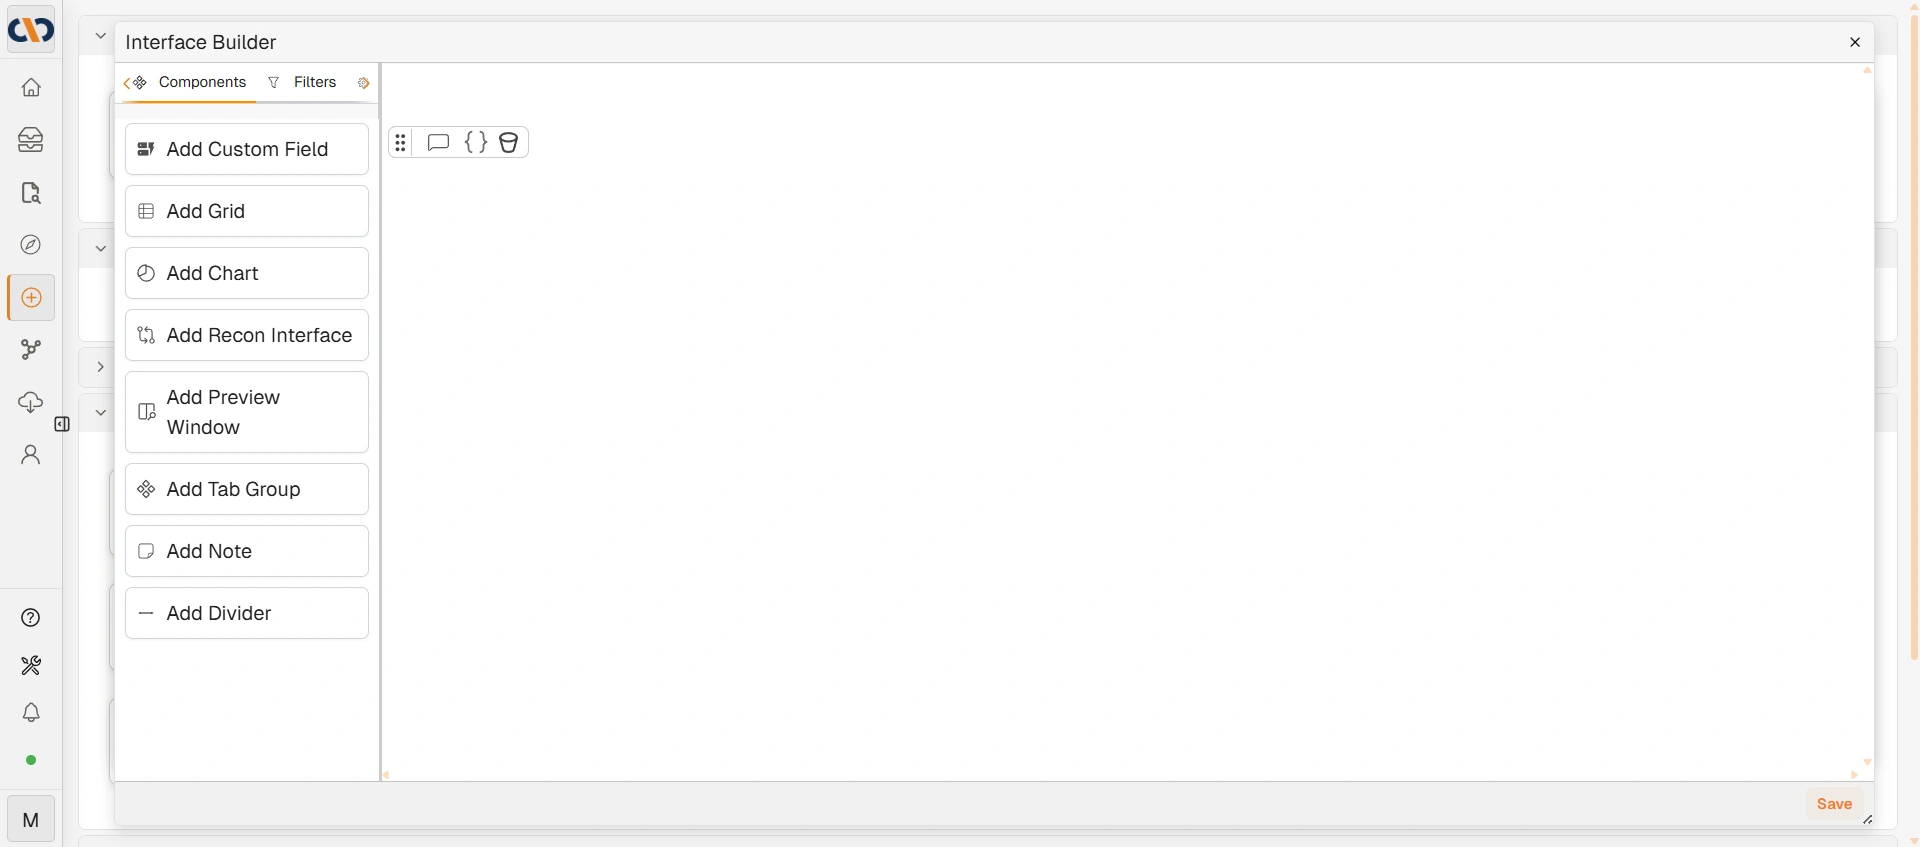
Interface Builder canvas
The left panel has three tabs:
Components
| Component | Description |
|---|---|
| Add Custom Field | Adds a section displaying custom fields. Requires a custom field selection and a document context to display data. |
| Add Grid | Adds a data grid section. Requires a virtual view (saved query) to be selected before data is displayed. |
| Add Chart | Adds a chart section. Requires a chart to be selected from those configured in the Chart Builder. |
| Add Recon Interface | Adds a reconciliation interface section. Requires instance-specific reconciliation configuration. |
| Add Preview Window | Adds a document preview panel. Displays the document file alongside its Tags panel. The preview updates when a document context is provided. |
| Add Tab Group | Adds a tabbed container. Components can be assigned to individual tabs, allowing users to switch between different datasets or views within a single section. Displays an active filter count badge when global filters apply. |
| Add Note | Adds a freetext note section. |
| Add Divider | Adds a visual section divider. |
Filters
Defines filters that apply across the entire interface. Filters created here are global — they apply to all relevant components in the interface simultaneously.
Click + Add/Edit to open the Add and edit filters dialog. Use + Add filters and dividers to create individual filters. Each filter has a Settings tab (filter type, label, and default value) and a Scoping tab (which components the filter applies to). Click Save to apply changes.
Settings
The Settings tab contains Validation Settings — rules that validate the interface against a data source and display a failure message when conditions are not met.
Click Open to open the Validation Settings dialog.
| Section | Description |
|---|---|
| Rules (left panel) | Lists all validation rules for this interface. Click Add Rule to create a new rule. Each rule has a name, an Enabled toggle, and a delete button. |
| Data Source | The virtual view the rule runs against. Select from available virtual views. |
| Rule Filter | Defines the condition logic for the rule. Click + Add condition to add a filter condition; click + Add inner group to nest condition groups. Conditions are combined with AND logic by default. |
| Edit Failure Markdown | Opens a markdown editor to define the message shown to users when the rule fails. |
| Validate | Sets how the rule evaluates the data source: any (passes if any row matches), none (passes if no rows match), or all (passes if all rows match). Treat as object (first row) evaluates only the first row of results. |
| Output Preview | Displays a preview of the rule output after clicking Run. |
| Run | Tests the rule against the current data source and displays results in Output Preview. |
| Save | Saves all validation rules for this interface. |
Added component
When a component is dragged onto the canvas, it appears as an Untitled Section block.
| Control | Description |
|---|---|
| Select | Opens the selection dialog for the component type (e.g. choose a chart, custom field, or virtual view). |
| View in Query Builder (eye icon) | Opens the underlying query in the Query Builder. |
| Delete (bin icon) | Removes the component from the interface. |
| Drag handle | Moves the section to a different position on the canvas. |
| Resize handle | Located in the bottom-right corner; adjusts the component's size. |
| Please select a context | A context is a document. Drag and drop a document from any grid to preview what the interface looks like against that document. |
Save Changes dialog
When Save is clicked, the Save Changes dialog appears.
| Field | Description |
|---|---|
| Name | Sets the name of the interface. |
| Allowed Users | Selects which users can view the interface. The current user is pre-populated. Leave empty to restrict access to administrators only. |
| Allowed Groups | Selects which groups can view the interface. |
| Save | Saves the interface and makes it available to the selected users and groups. |
How to build an interface
| Step | Description |
|---|---|
| 1 | Navigate to New > Custom Fields & Configuration > Interface Builder. |
| 2 | Click Create New Interface. |
| 3 | Drag components from the left panel onto the canvas. For each component, click Select to choose the chart, virtual view, or custom field to display. |
| 4 | Add Filters and configure Settings as required. |
| 5 | Click Save. Enter a name, and select which users or groups can view the interface. |
| 6 | The saved interface is visible to those users via Explorer > Virtual Interfaces. |
Troubleshooting
| Issue | Detail |
|---|---|
| Interface not visible to users | Check the Allowed Users and Allowed Groups settings in the Save Changes dialog. Users not listed will not see the interface in Explorer. |
| No charts available to add | At least one chart must be created in the Chart Builder before it can be added to an interface. |
| Component shows no data | Confirm the underlying virtual view has data. Test the query in the Query Builder. |
| Components out of order | Use the Drag handle on each component to reposition sections on the canvas. |
Drilldowns
Drilldown behaviour on grids within an interface is configured via SQL in the Query Builder, not within the Interface Builder UI itself.
Related configuration
- Chart Builder — creates the charts used in interfaces
- Query Builder — creates the virtual views that charts and grids draw from
- Building Virtual Interfaces — how the three tools connect
- Groups — managing the groups that can be granted interface access